Designing
Trust in AI-
PoweredRetail
Project Overview
Context & Business Background
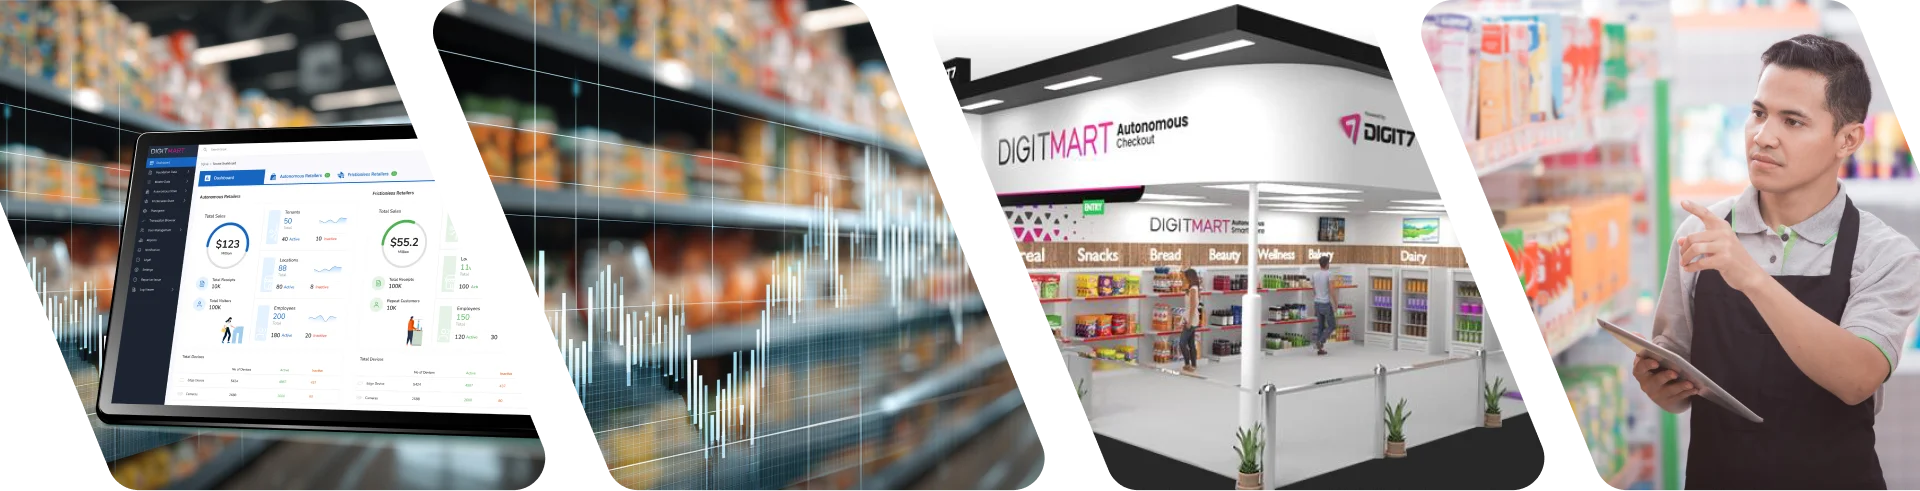
Behind the scenes, autonomous retail requires a massive, coordinated control plane connecting cameras, shelves, weight sensors, tenants, planograms, payments, and disputes. A failure or misalignment in any of these components halts the frictionless walk-out experience customers expect.
The unique UX challenge was that this system is not merely an admin tool—it is a real-time operating console. A missed alert or a poorly visualized anomaly means a customer leaves the store without paying, or worse, is charged for an item they didn't take. The business goals were ambitious: scale to thousands of stores, instill absolute retailer confidence in autonomous accuracy, surface anomalies before they evolve into customer disputes, and prove tangible ROI to skeptical retail executives evaluating the technology.
Target Audience Personas

Amelia, 47
Owns 12 autonomous micro markets; needs roll-up revenue and inventory health across all locations at a glance.

Sarah, 36
Reviews flagged transactions daily; needs immediate evidence (video + shelf images + sensor data) to resolve disputes in seconds.

Raj, 29
Physically maps every shelf in every store and configures cameras and IoT sensors; needs precision tools over pretty ones.
The Problem
“Autonomous retail is invisible magic — until it’s not. The hardest UX problem isn’t the customer’s 15-second walk-out. It’s the retailer’s 3am alert that something didn’t match.”
The project was defined by four core UX challenges:
Trust at scale:
Retailers needed to believe the AI was charging the right customer for the right product, every time.
Anomaly triage:
Flagged transactions (sensor disagreement, computer vision uncertainty, dispute claims) needed to be resolvable in under 60 seconds with all evidence in one view.
Physical-to-digital mapping:
Every gondola, shelf cell, camera, and IoT weight pad in the real store had to be configurable in software without requiring an engineer.
Multi-tenant complexity:
A single dashboard needed to scale from an independent micro market to a national chain operating 100+ stores.
Hypothesis: If we built the admin platform around evidence, confidence, and speed rather than overwhelming data tables, retailers would trust the technology enough to confidently scale it.
Discovery & Research
Our discovery phase included stakeholder interviews with 8 retail operations leaders, contextual inquiry at 3 live autonomous stores during peak hours, and shadowing an anomaly triage analyst for a full shift. We conducted competitive analysis of Standard Cognition, AiFi, and Trigo back-offices, performed heuristic teardowns of our v1 dashboard, and held technical co-design sessions with computer vision and IoT engineering teams.
The dashboard is read in 5-second glances
Retailers check the system between meetings; surface-level health must be unmistakable.
Evidence beats explanation
Operators don't want a text narrative; they want the video, shelf image, and sensor reading side-by-side.
Status colors become shared language
Green/amber/red shorthand is non-negotiable for rapid communication and triage.
Configuration is a craft
Planogram specialists are precision workers; their digital tools must match their physical exactness.
Design Strategy & Principles
Evidence Over Explanation
Show the video, the shelf image, and the sensor reading together; let the human operator make the final decision.
Status as Shared Vocabulary
Every entity (store, tenant, transaction, shelf) must carry a prominent, color-coded state.
Real-Time, Without Panic
Surface anomalies prominently, but utilize a calm visual treatment that supports analytical decision-making rather than inducing stress.
Configuration is a First-Class Workflow
Planograms are not an afterthought settings page; they are the core product for store setup.
"I didn't design a dashboard. I designed a retailer's confidence that the cameras, shelves, and AI in their store were telling the truth — and gave them the tools to verify it in seconds."
Trade-offs and Decision Rationale
Every major decision in this product involved balancing speed, clarity, trust, and scalability. The goal was not to make the interface look simpler than the system itself, but to make the complexity more actionable.
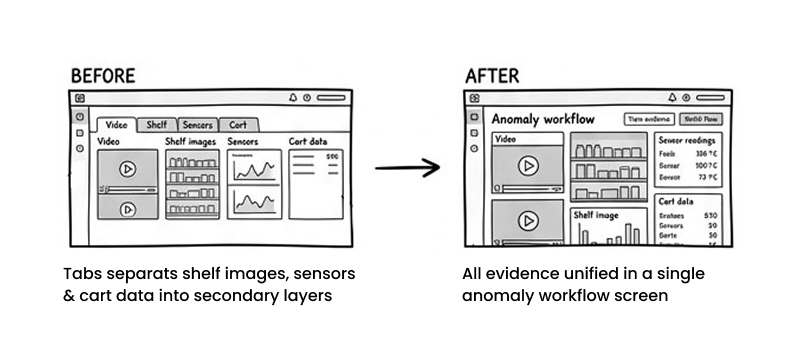
Evidence-first over visual minimalism
A cleaner UI could have separated video, shelf images, sensor readings, and cart data into tabs or secondary layers. I chose to surface them together in the anomaly workflow because users needed to verify events quickly without piecing the story together across screens.
Trade-off: a denser interface in exchange for much faster decision-making.
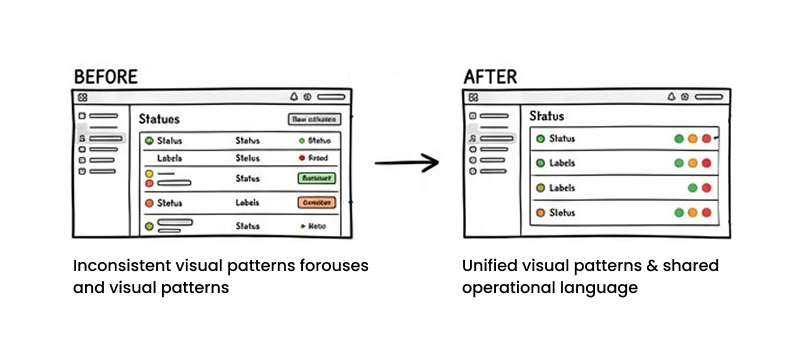
Consistency over novelty
I reused status patterns, labels, and visual logic across multiple parts of the platform. This reduced visual variation, but it made the system easier to scan and easier for teams to use consistently.
Trade-off: less visual distinctiveness, but a stronger shared operational language.
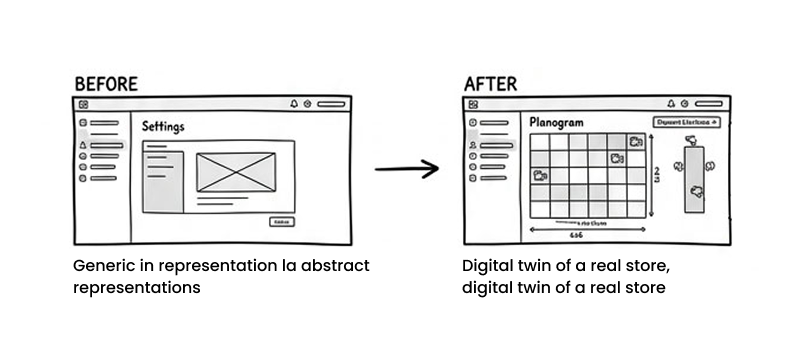
Physical accuracy over abstraction
For planogram and hardware configuration, I avoided reducing the product to a generic settings model. Users needed the interface to reflect the reality of the store.
Trade-off: more system detail on screen, but fewer setup errors and less ambiguity.
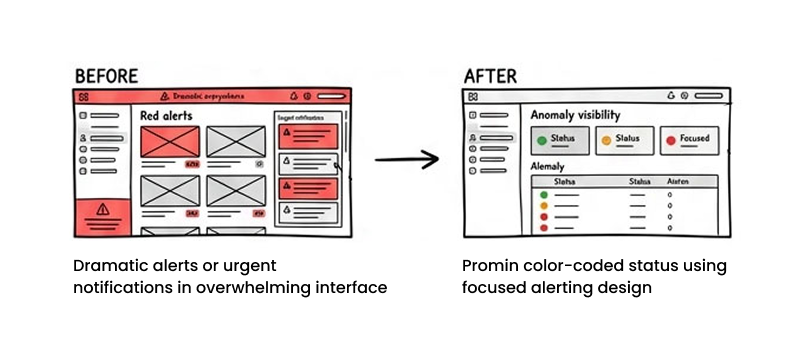
Calm visibility over constant urgency
In operations products, over-signaling every issue can create noise. I deliberately designed anomaly visibility to be prominent but controlled.
Trade-off: less dramatic alerting, but better focus and less fatigue in daily use.
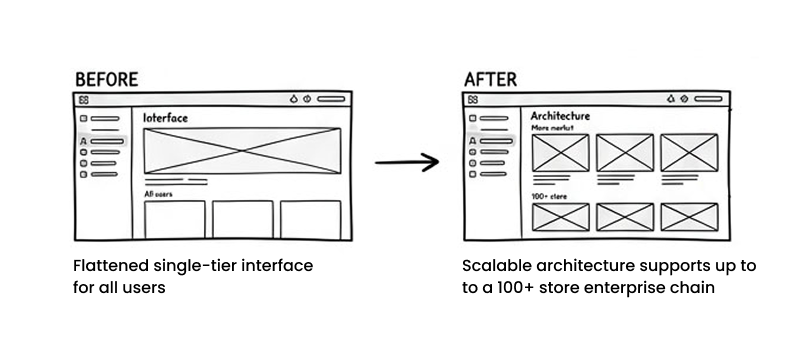
Scalability over oversimplification
The platform needed to serve both smaller operators and multi-tenant enterprise retailers. Rather than flatten the experience for everyone, I designed shared patterns that could hold more complexity when needed.
Trade-off: a more robust information architecture, but one that could scale without rethinking core workflows later.
Key Workflows Designed
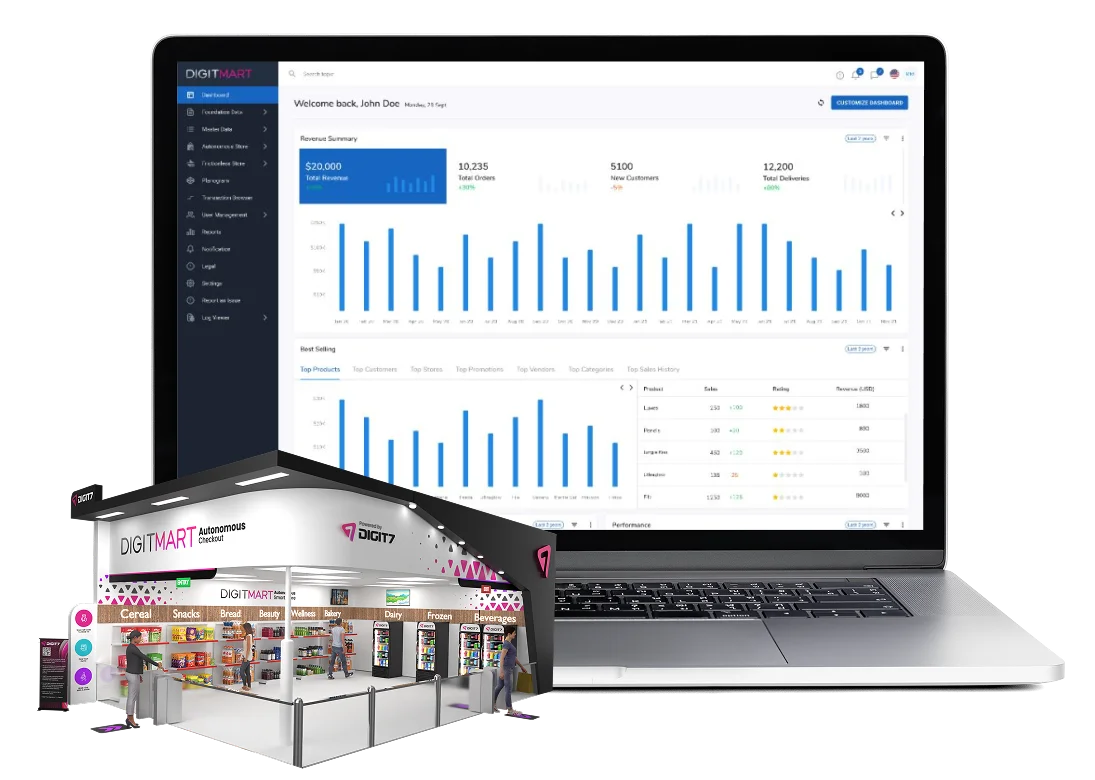
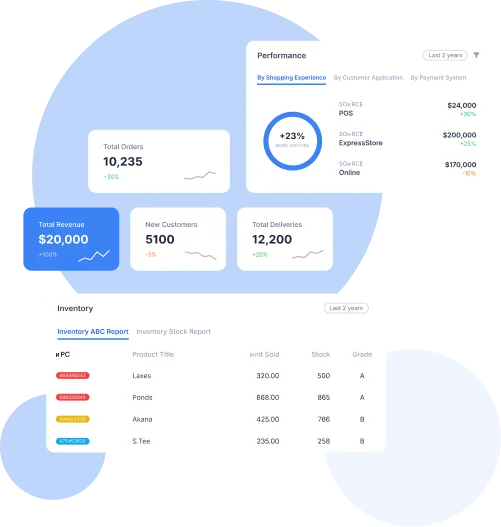
The Operations Dashboard
The dashboard is built for an executive read in 5 seconds. A 4-card revenue summary sits at the top (Revenue, Orders, New Customers, Deliveries). Below it, a 24-month bar chart accounts for seasonality, as micro markets spike around lunch and end-of-month paydays. The Best Selling block uses tabs (Top Products, Customers, Stores, Promotions, Vendors, Categories, Sales History) because every retailer asks a different "what's working" question; tabs let them all coexist neatly. The Inventory ABC Report color-codes grades (red/amber/green) so the operator can scan and act instantly. The Orders block isolates re-orders, cancellations, cart abandonment, returns, and conversion rate—the true health metrics of autonomous retail.
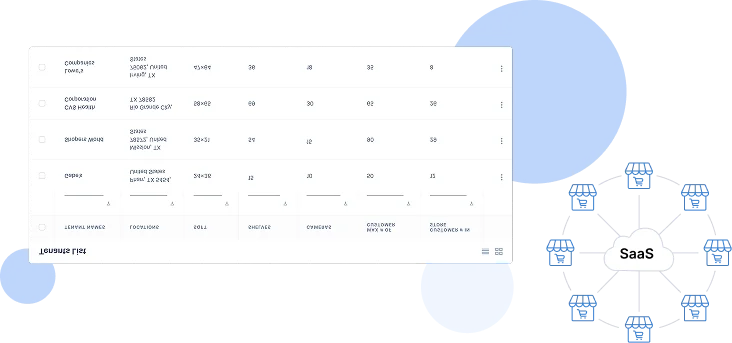
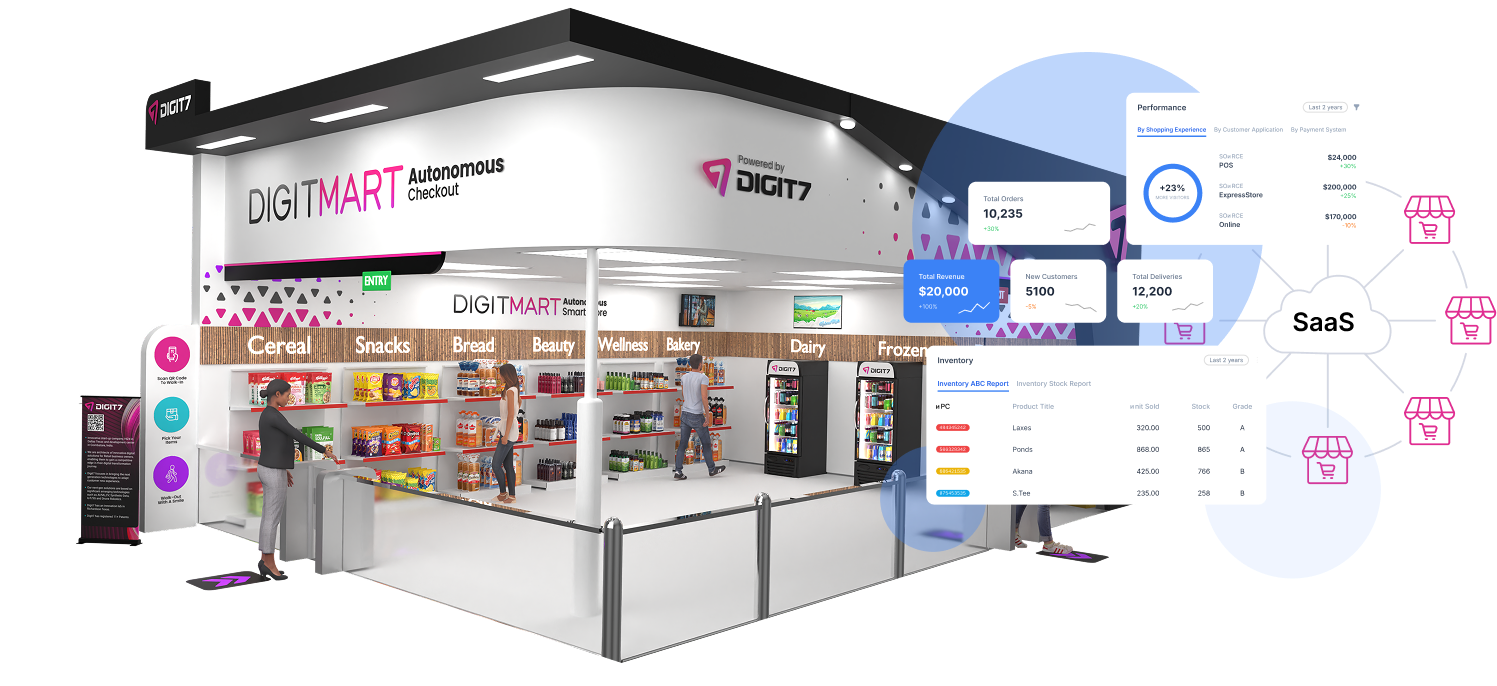
Multi-Tenant Store Management
A tab pattern (Dashboard / Tenants) enables brand parents to view all child tenant brands (e.g., Walmart, Target, CVS). Search by location supports retailers operating regionally. The Tenants table is designed entirely around physical store specs (SQFT, Shelves, Cameras, Max Customer Capacity, Current # in Store)—the exact numbers that matter when planning autonomous deployments and monitoring load.
Transaction Browser
(The Anomaly Resolution Console)
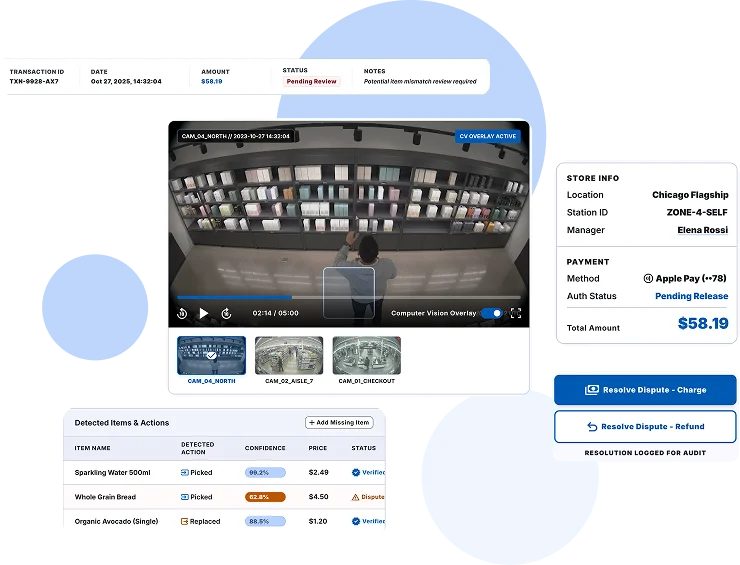
This is the heart of the product. The top strip surfaces federally-relevant outcomes. Below, Store, Customer, and Payment are split into three columns, with payment dispute status flagged in red the moment it is contested.
The Cart Summary table features per-item flags: CV Under Review (computer vision uncertain), CV/Sensor Issue, and IOT Under Review, comparing Actual Weight vs. Standard Weight. Rows that disagree are color-banded so operators notice them first. Crucially, the Surveillance Video panel provides 4 synchronized camera angles, because the cart is incomplete without visual proof. Paired with Shelf Image evidence (timestamped with "Product Picked Up / Placed Back" badges), it turns a sensor event into a verifiable story. Outcome: Average flagged-transaction resolution time dropped from 8+ minutes to under 90 seconds.
Transaction Browser — when the AI is uncertain, the operator sees everything: cart, video, shelf image, weight, and history, side by side.
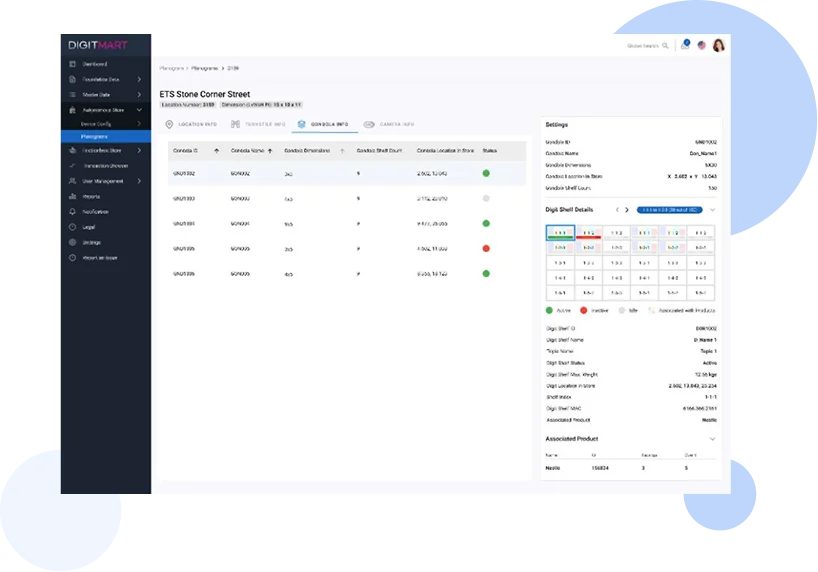
Planogram & Hardware Configuration
The tabbed information architecture (Location / Turnstile / Gondola / Camera) follows the physical setup workflow, allowing specialists to configure software in the exact order they install hardware. The Gondola list utilizes traffic-light status dots (green/red/grey for Active/Inactive/Idle) to let a specialist scan store health in a second. The right side panel pairs the abstract grid (a 6x6 representation of every shelf cell) with per-cell precision data (Digi Shelf ID, Max Weight, MAC address, GPS-style coordinates, Associated Product). This digital twin ensures total alignment between the real world and the system.
Planogram configuration — the digital twin of every shelf, camera, and weight pad in the physical store.
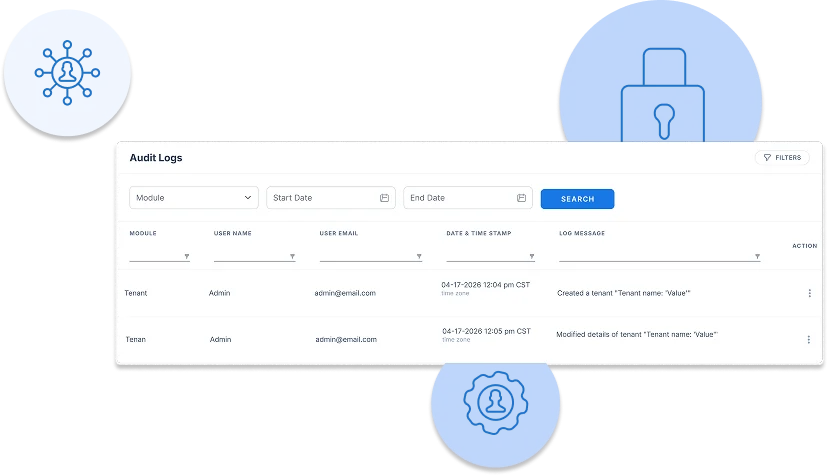
Audit Logs
Audit investigations always start with "what changed in this module last week?" so module and date-range filters sit at the top. The Log Message column is written in plain language (e.g., "Created a tenant...", "Modified details of tax provider...") so non-engineers can read the trail. System Actions are separated from human-driven events, and connectivity test failures surface the exact reasoning inline. Audit logs must explain themselves completely.
UX Decisions That Mattered
Color-coded status
A shared team vocabulary using green/amber/red across every screen and entity.
Evidence-first triage
Video, shelf image, sensor, and cart data in one unified view, never hidden behind tabs.
Color-banded anomalies
A shared team vocabulary using green/amber/red across every screen and entity.
Tabs for varying questions
Best Selling features 7 tabs because retailers ask 7 different questions about the same dataset.
Physical-to-digital twin
The abstract shelf grid mirrors the real-world physical shelf, position for position.
Plain-language audits
Audit messages designed for non-engineers to independently investigate and resolve issues.
Accessibility & Inclusion
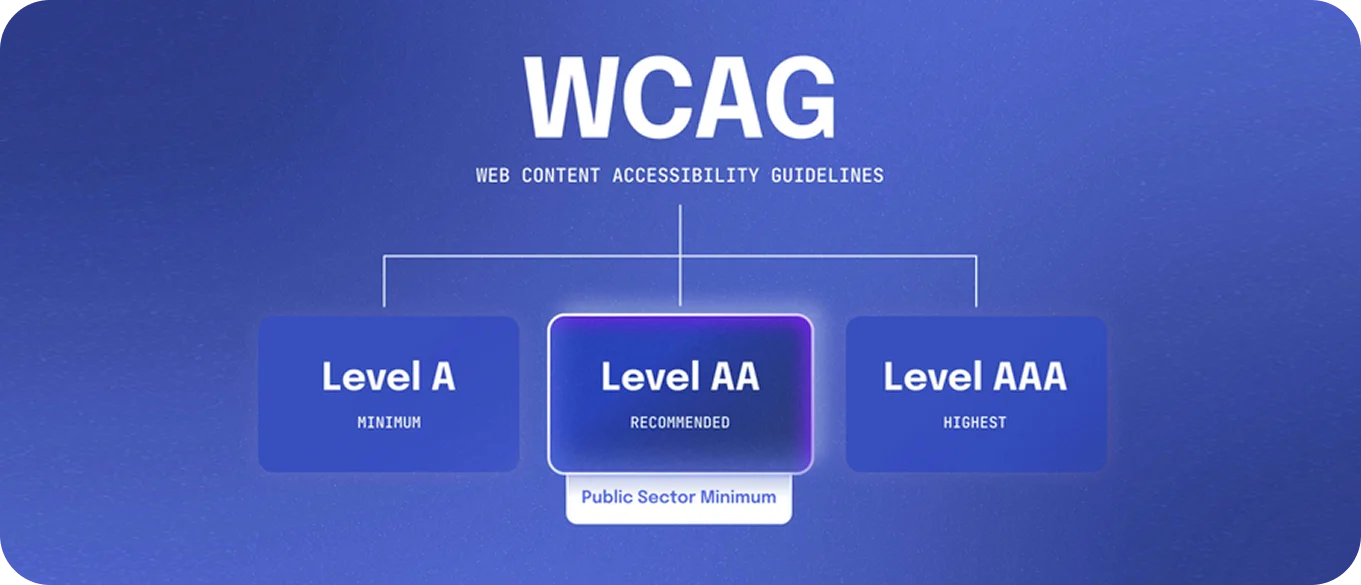
We achieved WCAG 2.1 AA compliance across the platform. This included enforcing a 4.5:1 minimum contrast ratio on all body copy and ensuring comprehensive keyboard-only navigation for power users—crucial for anomaly analysts who triage 100+ transactions daily, where mouse latency significantly adds up. Focus states were designed directly into the atom layer, and screen reader labels were added to all status indicators.
“Retail operations teams work nights, weekends, and stressful peaks. The interface has to perform when the human can't. We never rely on status-by-color-alone."
Impact (Outcomes & Engagement)
Flag Resolution
on Platform
Reduction
Lift
Wait Eliminated
Achieved
The engagement story was profound. Retailers trusted the technology enough to expand their footprint from single pilots to multiple locations. Operations managers were able to clear anomaly queues significantly faster, drastically reducing operational bottlenecks.
Planogram specialists found that they could onboard new stores in days instead of weeks, relying on the intuitive physical-to-digital mapping. Multi-store retailers began using DigitMart as their primary morning ritual.
The dashboard ultimately became the first browser tab of the day for many retail operators, proving that when complex data is transformed into clear, actionable intelligence, it earns a permanent place in the daily workflow.